How to Create an MIS Report in Excel: A Step-by-Step Guide
Introduction
Introduction
Management Information System (MIS) reports are very important to companies when it comes to analyzing data and making sound decisions. Excel is among the best software to use in designing MIS reports due to its ease of use and flexibility.
In this tutorial, we guide you, step by step, through how to create an MIS report in Excel, from data extraction to setting up dashboards to leveraging advanced facilities. Also see 15-advanced-excel-skills-you-must-know/.
Also read 15-advanced-excel-skills-you-must-know/

What is an MIS Report?
What is An MIS Report?
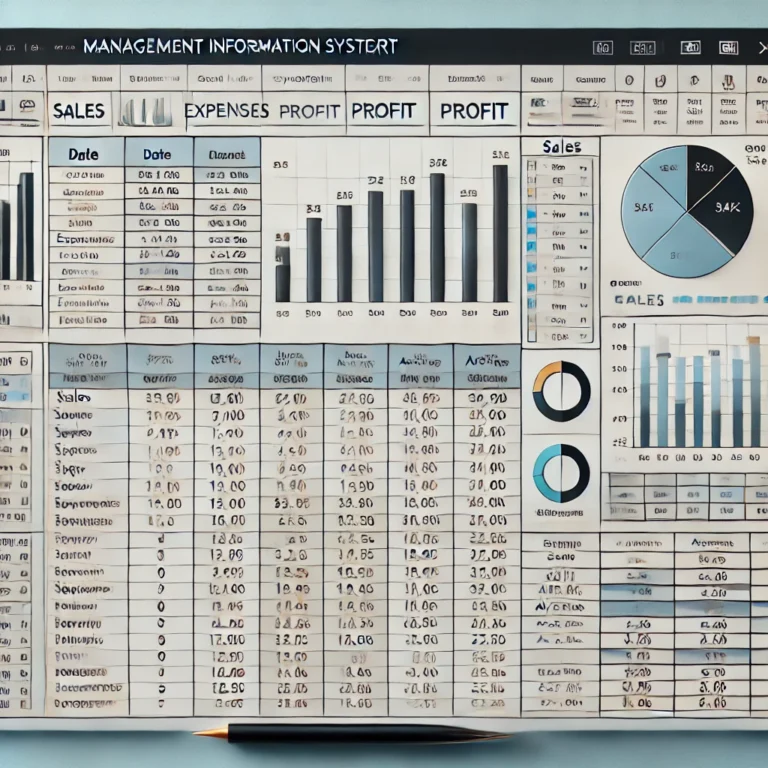
An MIS report consolidates and presents information in a structured manner to allow companies to track performance, analyze trends, and make strategic choices. An MIS report includes vital measures, tables, charts, and graphs to allow for better visualization.
🔍 Recommended read : Is Deepseek AI better than ChatGPT?
How to Prepare an MIS Report in Excel
Step 1: Gather and Consolidate Data
Begin by gathering relevant information from various locations like sales reports, employee performance, or stock reports.
Open Excel and create a neat table.
Enter data in tabular form.
Example:
Date
Sales Amount
Expenses
Profit
01/01/2025
10,000
5,000
5,000
01/02/2025
15,000
7,000
8,000
Step 2: Clean the Data
Verify accuracy of data by eliminating errors and duplicates.
✅ Apply Data Validation to limit the invalid input. ✅ Remove duplicates by going to Data > Remove Duplicates. ✅ Format the table using Ctrl + T for better readability.
Step 3: Insert Formulas for Calculations
Use Excel formulas to compute key numbers such as totals, averages, or percentages.
Profit Calculation: =Sales Amount – Expenses
Total Sales: =SUM(B2:B10)
Average Profit: =AVERAGE(D2:D10)
Step 4: Integrate Data Visualizations
Charts and graphs provide MIS reports with greater insights.
Choose your data.
Go to Insert > Choose Chart Type (e.g., Bar Chart, Pie Chart, Line Chart).
Include titles and labels for clarity.
Step 5: Develop a Dashboard (Optional)
Make your report interactive with a dashboard.
???? Use Pivot Tables: Insert a PivotTable and arrange fields as per requirement. ???? Insert Slicers: Quickly filter data by selecting suitable fields.
Step 6: Use Conditional Formatting
Emphasize key metrics with color-coded guidelines.
Example: To highlight profits within a limit:
Select the Profit column.
Proceed to the Home tab, select Conditional Formatting, and Highlight Cell Rules and then Less Than.
Input the threshold value (e.g., 5000) and choose a formatting style.
Step 7: Save and Share
Save the report under an appropriate name like Monthly_MIS_Report.xlsx and share it via email or cloud platform like Google Drive.
Also Read: Advanced Excel Guide
Advanced Excel Functions for MIS Reports
Enhance the credibility of your MIS reports with these Excel skills:
1. Sophisticated Formulas for Automation
Excel formulas simplify complex calculations and generate dynamic reports.
INDEX-MATCH: Quickly look up values.
IF Functions: Make logical choices automatically.
TEXT Functions: Format data properly.
???? Example: =IF(A2>5000, “High Sales”, “Low Sales”)
2. Conditional Formatting for Insights
Highlight important data points through color coding and data bars.
3. Pivot Tables for Summarizing Data
Quickly summarize big data.
Dynamically filter data with slicers.
4. Drop-Down List and Data Validation
Limit data entry to certain values.
Improve usability with drop-down lists.
5. Charts and Dashboards
Combine multiple chart types.
Filter live data using slicers.
6. Power Query for Data Integration
Automate data cleaning and extraction.
Seamlessly integrate data from different sources.
7. Macros für Automation
Use macros to automate repetitive tasks:
Enable Developer Mode for Excel.
Make a macro for calculations or for formatting.
Bind the macro to a button to run swiftly.
8. Data Protection and Security
Password-protect sensitive reports.
Lock key cells to prevent accidental changes.
???? Need additional Excel tips? Visit the Microsoft Excel Help Center for professional tips.
Conclusion
Creating an MIS report in Excel is a good way of analyzing business data effortlessly. With Excel formulas, charts, PivotTables, and automation tools, you can create useful reports to guide decision-making. ???? Begin Today! Use these steps to produce your first MIS report and take your business analysis to the next level.
Benefits of MIS Reports
MIS reports provide structured insights that help businesses operate efficiently.
1. Improved Decision-Making
MIS reports analyze data trends to guide business strategies.
2. Enhanced Efficiency
Automate calculations to save time and reduce errors.
3. Better Resource Management
Optimize inventory and workforce planning with structured reports.
4. Real-Time Monitoring
Track business performance in real-time with dynamic dashboards.
5. Enhanced Accuracy
Minimize human errors with automated data processing.
6. Strategic Planning and Forecasting
Predict future trends based on historical data insights.
7. Customization and Flexibility
Tailor reports to fit business-specific needs.
8. Better Communication and Collaboration
MIS reports centralize data, improving transparency across departments.
Check more data and info on Microsoft Help Center
Conclusion
Creating an MIS report in Excel is a powerful way to analyze business data efficiently. By leveraging Excel’s formulas, charts, PivotTables, and automation tools, you can create insightful reports that help in decision-making.
📌 Get Started Today! Use these steps to build your first MIS report and take your business analysis to the next level.
💬 Have questions? Drop a comment below!
📢 Stay Updated! Subscribe to our newsletter for more Excel and data analysis tips.
🔗 Related Reads: Top 10 AI Tools for Data Analysis | Mastering Excel in 30 Days

Share this blog post
